un:hr
This is an old revision of the document!
HR diagram
HR (Hertzsprung-Russell) diagram relates the luminosity $L$ and the effective surface temperature $T$ of stars. These two quantities are linked to the radius $R$ of a star via the equation of flux, $\mathscr{F}=\sigma T^4=L/(4\pi R^2)$, meaning
$$ R = \frac{\sqrt{L}}{\sqrt{4\pi\sigma}T^2} = \frac{\sqrt{L/L_\odot}}{(T/T_\odot)^2} \ R_\odot $$
where $L_\odot$, $T_\odot$ and $R_\odot$ are the luminosity, temperature and radius of the sun. This means there are diagonal constant-radius lines in the HR diagram. An HR diagram can be shown using either $T$-$L$ or the corresponding observable quantities color index and absolute magnitude. Both temperature-luminosity and color-magnitude versions are shown below [clicking the image will open the corresponding applet of NAAP Labs].
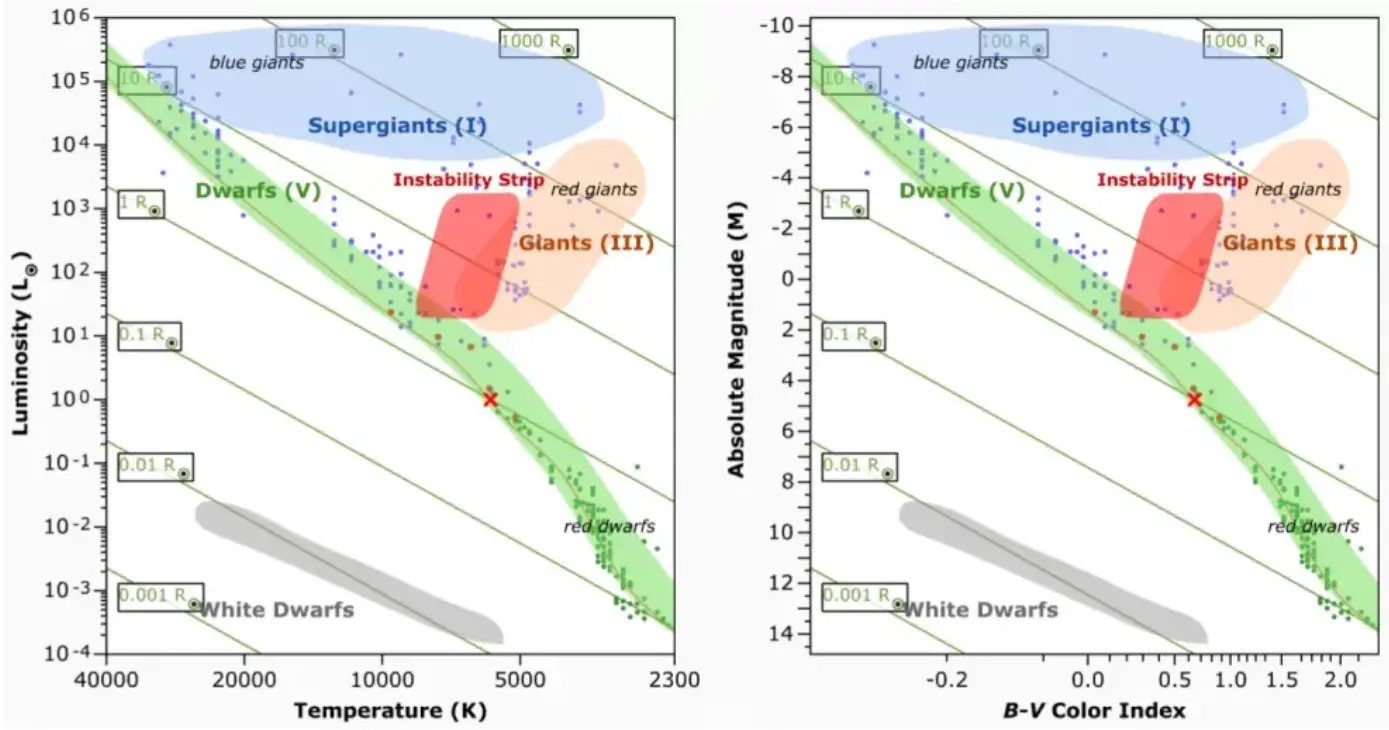
B-V color index is the difference between apparent magnitudes in the blue and visual or yellow bands, i. e. $m_B-m_V$. The absolute magnitude on the $y$-axis is the yellow magnitude $M_V$. A negative B-V index means $m_B<m_V$ and, hence, the brightness in blue wavelengths is greater than in the visual band. Note that $M_V\propto - \log L$ and $(m_B-m_V)\propto -\log T$ which will be evident if you compare the axes of the two panels.
The green patch in the HR diagram is the main sequence where a star stays during its stable period. Before the birth a star is to the lower right hand side of the main sequence. When the equilibrium of the star is broken, it moves to the upper right hand side of the main sequence toward the giant (light red) or supergiant (blue) branches. After death stars move to the lower left hand side of the main sequence near the white dwarf patch (grey). Some massive stars oscillate periodically and they are found in the instability strip (dark red). On the main sequence the heavier stars are found in the upper part, and vice versa.
HR diagrams have been such fantastic infographics in astrophysics that their creators Hertzsprung and Russell have been called the Minards of astronomy, where Minard is the French engineer who became famous by drawing the most influential infographic of the 1812 Ruassian campaign of Napoleon in 1869.1)
1)
Broek & Russo, 2014, Communicating Astronomy with the Public Journal, Volume 14, p.17.
un/hr.1713252690.txt.gz · Last modified: by asad